Overview
Once you have installed BigBlueButton it is important to setup or integrate BigBlueButton into a monitoring system. A popular monitoring stack nowadays is Prometheus, Grafana and Alertmanager.
-
Prometheus is used to collect metrics. It collects these metrics by visiting a service's endpoint, which exposes metrics in the Prometheus format. If a service does not natively support Prometheus metrics, you can install exporters which query the service and expose metrics in the appropriate Prometheus format. For a quick and effective introduction into Prometheus go over the getting started documentation. In this article, we describe all exporters that are relevant to the operation of BigBlueButton.
-
Grafana is used to visualize metrics, logs and other data from different data sources including Prometheus. It is common practice to view Prometheus metrics using Grafana. User's must write a collection of panels (a panel is a graph, table or any other visual element of a metric) in a dashboard. For common dashboards there are pre-made dashboards that you can download from Grafana's website.
-
Alertmanager is an extension written by the Prometheus folks. It is used to trigger alerts to Email, Slack, PagerDuty, etc. from predefined suspicious metrics (CPU utilization > 75%, 90% RAM usage, 90% disk storage used, etc.).
Prometheus, Grafana and Alertmanager work together to form a highly flexible, extensible and powerful monitoring solution.
BigBlueButton Metrics
Currently BigBlueButton does not expose and metrics, however there is a community driven project that has implemented a Prometheus exporter which enables you to scrape using Prometheus key BigBlueButton metrics.
BigBlueButton Exporter
BigBlueButton Exporter is a community driven project to expose various metrics that are available via the API that BigBlueButton exposes.
Metrics that are exposed:
- Number of participants by type (listeners, voice, video)
- Number of participants by client (HTML5, dial-in)
- Number of recordings (processing, published, unpublished, deleted, unprocessed)
- Number of participants in rooms by bucket
The Grafana dashboard that is enabled by the project:
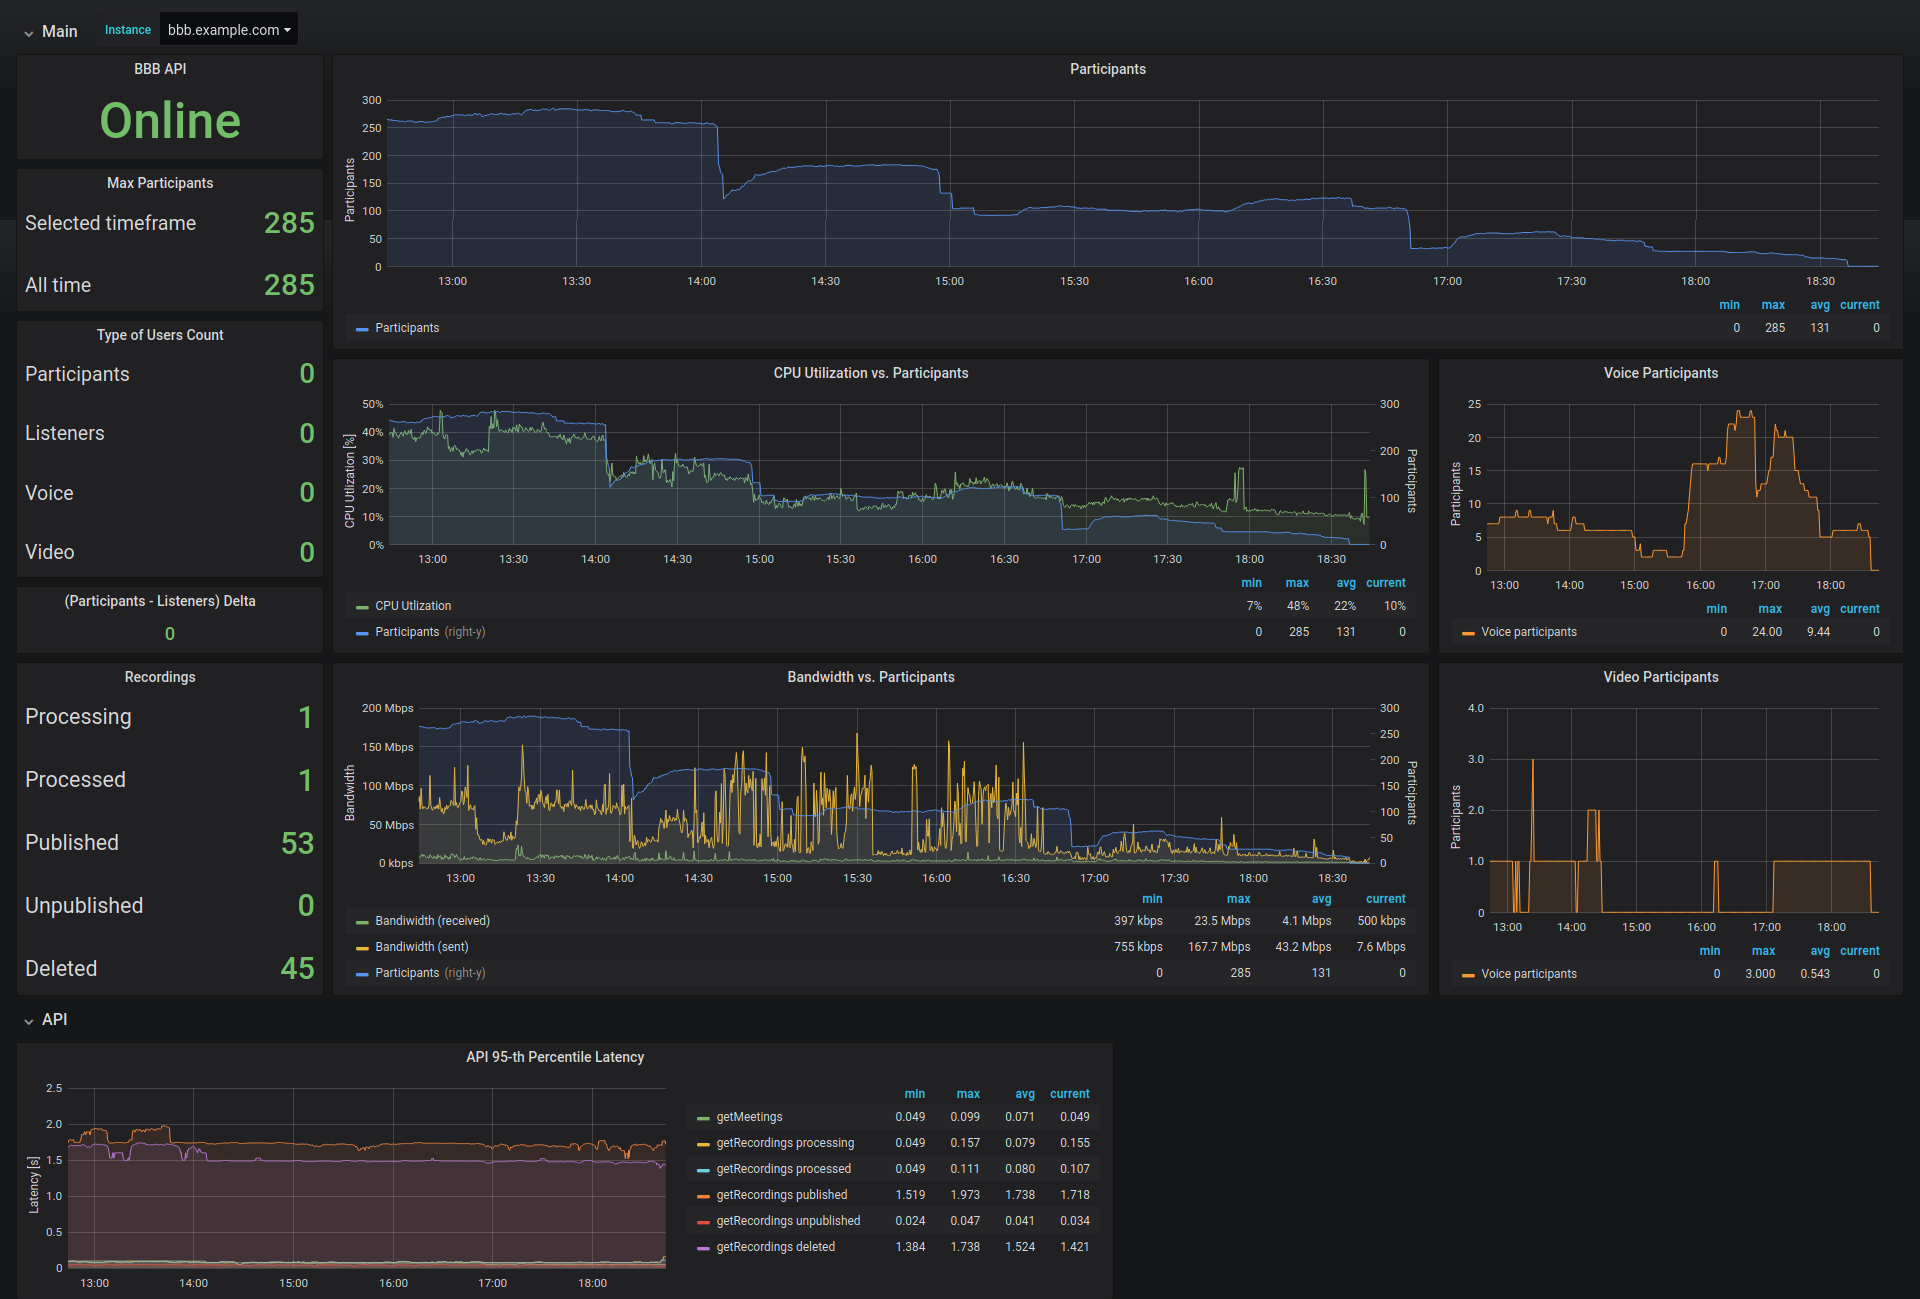
The project's documentation is extensive and guides your through multiple different installation setups. As well as provides Grafana dashboards with different views: all servers aggregated and single specific server.
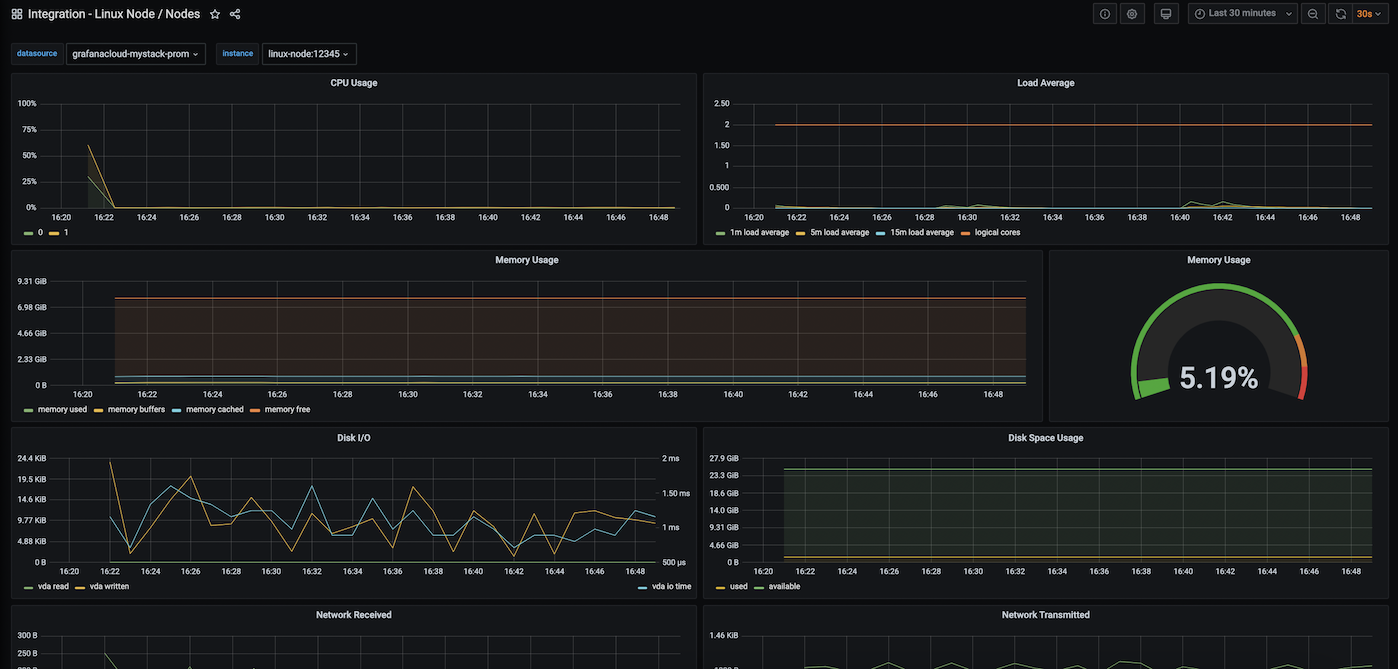
Monitoring the system
The Prometheus Node Exporter collects fundamental metrics from the underlying operating system that BigBlueButton is running on. It collects over 500 values, including CPU and memory usage, disk IO and network statistics. These will help to observe the basic system behavior via Grafana and alert on abnormalities via Alertmanager.
There are three different Node Exporter dashboards for Grafana depending on your usecase. The most basic looks like this:
Monitoring individual systemd services
The third-party systemd exporter can be used to monitor BigBlueButton services on a systemd level, i. e. track the usage of resources for every service. This allows fine-grained insights into the resource usage and distribution among the various components of BigBlueButton.
The following command line will start the systemd exporter and instruct it to only monitor services relevant to BigBlueButton on port 9558:
systemd_exporter --systemd.collector.unit-include=(bbb.*|b3scale.*|freeswitch)\.service
It can be queried via curl http://bbb.example.com:9558/metrics.
Note: You need to provide appropriate firewalling to those endpoints.
Internal BigBlueButton Metrics
Some of the components in BigBlueButton provide Prometheus scraping endpoints. The exposed information can help in operation to troubleshoot issues or optimize the system towards goals such as scalability, particularly when special requirements mandate adjustments. They are not required for normal operation.
Note: You need to provide appropriate firewalling to those endpoints.
WebRTC SFU
BigBlueButtons Selective Forwarding Unit can be configured to expose a number of Prometheus endpoints by adding the following snippets to
/etc/bigbluebutton/bbb-webrtc-sfu/production.yml:
prometheus:
  enabled: true
  # mcs-core specific metrics
  host: localhost
  port: 3014
  path: '/metrics'
  collectDefaultMetrics: false
  # Main process metrics endpoint (main == websocket entrypoint, module manager)
  main:
    host: localhost
    port: 3016
    path: '/metrics'
    collectDefaultMetrics: false
  # Video process metrics endpoint (video == webcam req handler, ...)
  video:
    host: localhost
    port: 3026
    path: '/metrics'
    collectDefaultMetrics: false
  screenshare:
    host: localhost
    port: 3022
    path: '/metrics'
    collectDefaultMetrics: false
  audio:
    host: localhost
    port: 3024
    path: '/metrics'
    collectDefaultMetrics: false
After a restart of bbb-webrtc-sfu, the metrics can now be queried via
curl http://bbb.example.com:3014/metrics(mcs-core)curl http://bbb.example.com:3016/metrics(main)curl http://bbb.example.com:3026/metrics(video)curl http://bbb.example.com:3022/metrics(screenshare)curl http://bbb.example.com:3024/metrics(audio)
respectively.
HTML5 Frontend (experimental)
The HTML5 Frontend servers can be configured to provide Prometheus endpoints by adding
the following to /etc/bigbluebutton/bbb-html5.yml:
private:
    prometheus:
        enabled: true
        # Metrics endpoint path
        path: '/metrics'
        # Whether default metrics for Node.js processes should be exported
        collectDefaultMetrics: false
        # Whether redis metrics should be exported
        collectRedisMetrics: false
After a restart, the metrics will be available at https://bbb.example.com/html5client/metrics.
Note: The endpoint is unprotected. You need to configure nginx access control to this URL yourself.
Optimization: Consolidating local metrics endpoints
Using 3rd party software such as exporter_exporter or reverse_exporter, it is possible to consolidate all of the above endpoints into a single metrics endpoint. This simplifies scraping and reduces the amount of connections across machines. This also allows the other exporters to be either firewalled or bound to localhost. Only the port of the proxy exporter will need to be exposed for the prometheus server to scrape it.
All-In-One monitoring stack
If you do not wish to install Prometheus and Grafana by yourself, an interesting feature is the All-In-One monitoring stack. The documentation guides you how to setup the entire monitoring stack (Prometheus, Grafana and BigBlueButton exporter) on your BigBlueButton server by using a single docker-compose file. This is useful if you are administering a single BigBlueButton server and have no existing monitoring infrastructure.